
In our previous blog, we shared how dashboards and access to data in real-time is now a necessity, especially in the remote-working world we find ourselves. Not for Profit organizations need to have access to the details that are mission critical. Here, we take a closer look at how dashboard reporting can serve as an invaluable tool for Not for Profits and their board members, executives, finance professionals and other stakeholders.
Generating any type of financial report has historically been the responsibility of the organization’s finance team. While the overseeing and finance management remains the responsibility of financial leadership, specific information is needed by other stakeholders within the organization. Many finance professionals can relate to this common statement, “I just have one quick question”. Field a few of those and there goes the bulk of your day. So, in addition to dashboard reporting being a great time-saver for the accounting team, there are several other crucial reasons why your organization should employ dashboards.
Do away with manual processes
When financial information is spread out across the organization in spreadsheets, PDFs or even in staff member’s email accounts, coupled with manual processes to consolidate data, it quickly becomes challenging to provide insight to stakeholders in a timely manner. Dashboards can provide real-time visibility to crucial data points and can save your organization hours otherwise spent on checking data accuracy, approving batches prior to posting, and generating reports for different roles within the organization.
Dimension-driven reporting
Historically a chart of accounts (COA) would have multiple segments to the account code to identify attributes like department, location, profit center, etc. The result of this methodology is that the COA can become unwieldy over time involving thousands of accounts. The concept of dimensions to manage these attributes has many benefits. It allows you to significantly 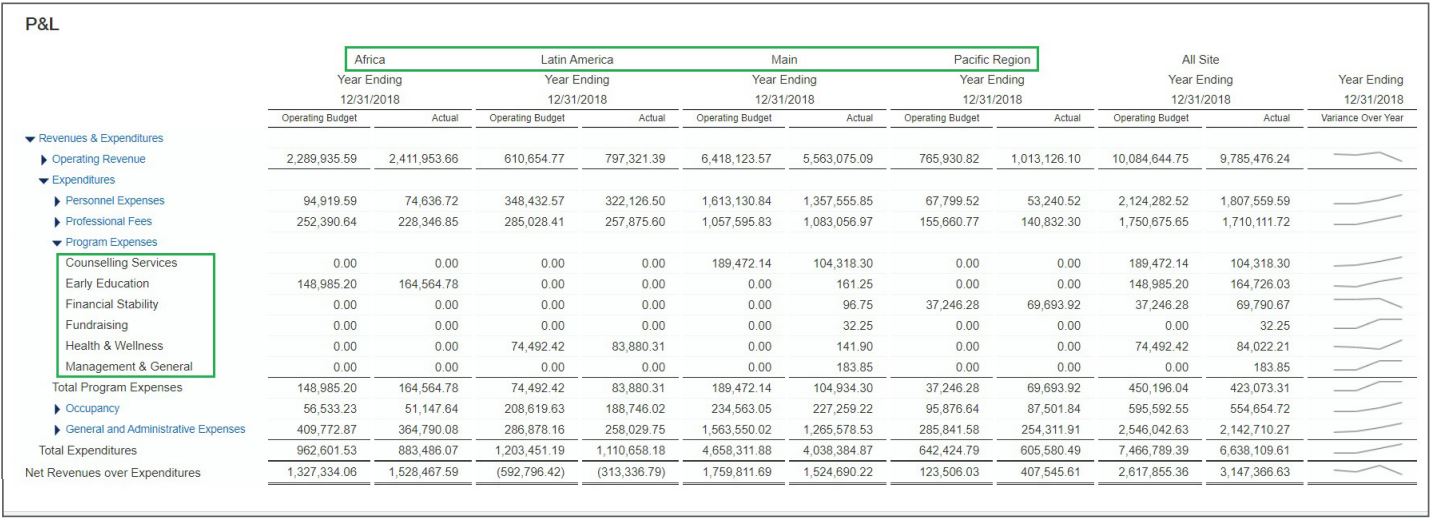 streamline to COA to only the natural account while the dimensions identify the various attributes for posting, allocation, and reporting purposes. Creating reports is no longer limited to report writing tools like Crystal. Dimensions allow users to “pivot” or view data from different angles quickly and easily. Dashboards displaying real-time data deliver mission critical information without having to manage a complex chart of accounts.
In-Application Collaboration
Communication with colleagues when you’re working in a virtual environment can be more challenging. The quick pop by is not possible. When the finance director needs the backup documents or needs to ask a question about a transaction, without a system in place that can deal with it, the process becomes labor intensive and time-consuming, potentially delaying the dissemination of key data to stakeholders.
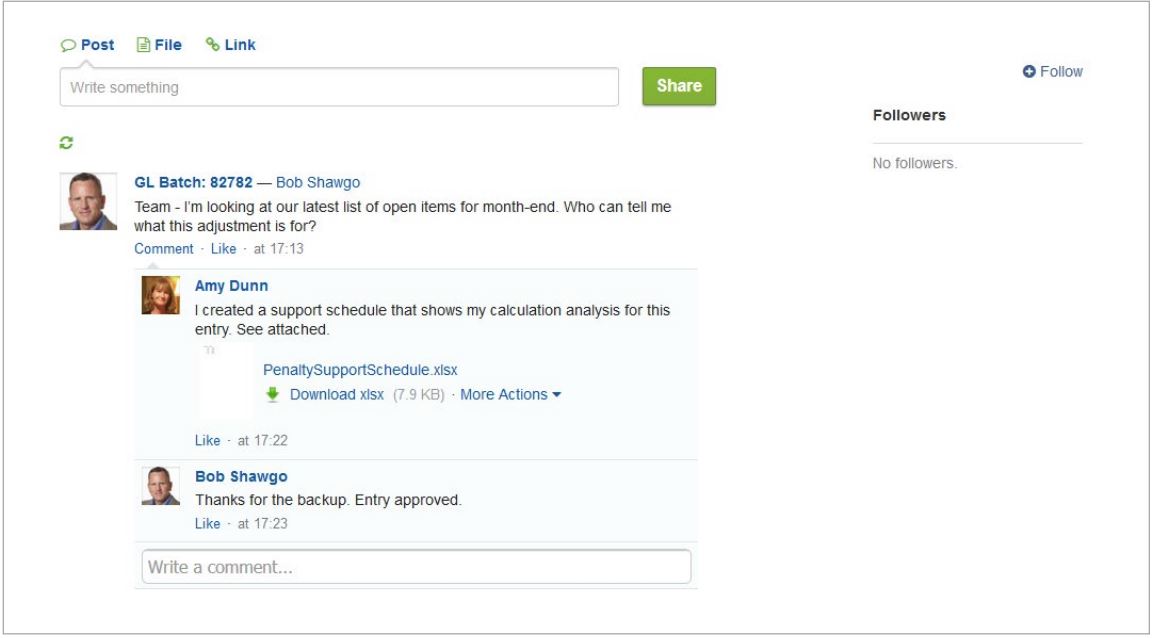 The ability to attach documents to transactions and in-application messaging that stays with the transaction is invaluable. It helps to create an audit trail with all necessary backup and queries with their associated responses. This means the accounting system if the only system of record for the organization making audits much quicker, easier and less expensive.
Visuals – Charts & Graphs
For most people it’s much easier to process information that is presented graphically rather than in a report filled with columns and rows of numbers. Visual indicators quickly draw your attention to areas that may require immediate action like rising costs on a project or when coming close to budget allocation. The types of performance metrics that can be tracked is virtually limitless. Each functional area can have their own. This gives finance leaders time to focus on other meaningful tasks and more importantly, strategic initiatives.
Tailored Dashboards (Views)
Customizing the reporting experience using real-time views means finance professionals will no longer spend hours preparing and updating reports for the different stakeholders of the organization. User security settings allow board member to see financials, program mangers 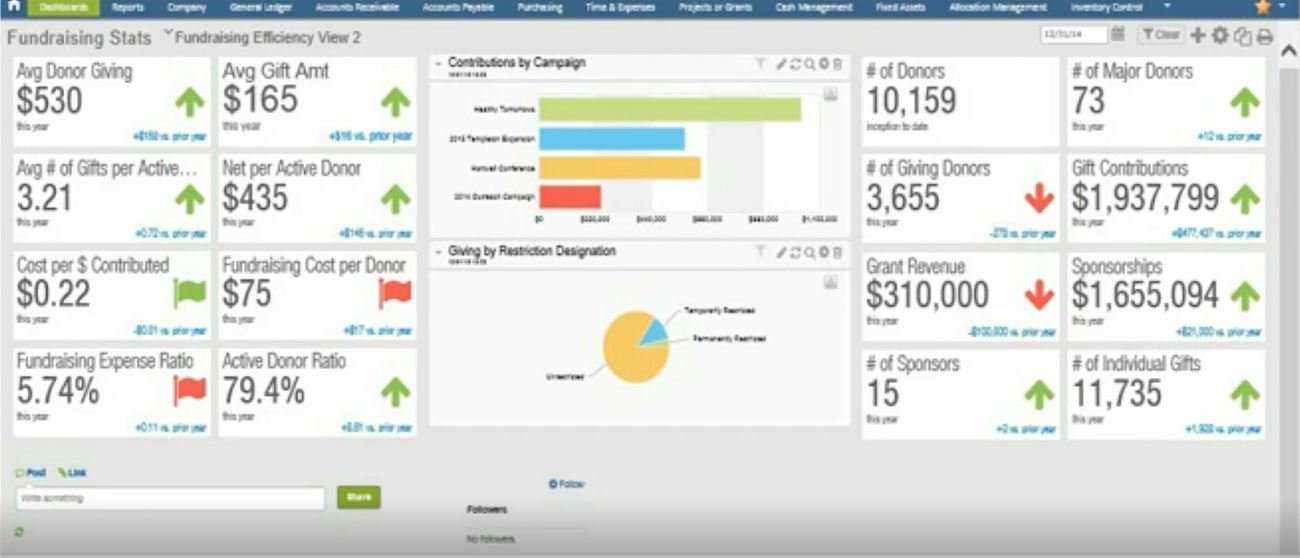 access to their budgets and other KPI’s, all relevant to their specific roles.
Consider how much more efficient your Not for Profit organization would be if these real-time dashboards were available on demand:
- Role-based dashboards: role-based dashboards provide at-a-glance views of relevant information based on programs and responsibilities—like visibility into revenue and operational efficiency for leaders, metrics related to programs and budgets for program managers, and fundraising efficiency for development.
- Fundraising Dashboard: Easily track and tag your expenses and revenue to automatically calculate fundraising metrics like number of donors, scholarships, average giving and more.
- Outcomes Dashboard: When you combine financial and operational data into a single multi-dimensional Outcomes dashboard, you can share a true picture of your organization’s impact with donors.
Investing in a solution that has real-time transactions and dashboard reporting capabilities empowers Not for Profit organizations to look forward rather than backward and be more strategic, at every level – beyond just the finance department. Program mangers, Board members, executives and other staff can have the information they need, at their fingertips, and be confident in their data-driven decisions that ultimately help the organization fulfill its mission.
If you’d like to learn more about real-time data and dashboards reports, book some time on my calendar to discuss how Sage Intacct does it beautifully.
+1 (888) 599-1115 | www.north49.com | solutions@north49.com